

Sundaram PMS: SELF, SISOP, Rising Stars and Voyager Strategies

Sundaram PMS is the portfolio management service of Sundaram Alternates, a Sundaram Finance group company. Four of its equity strategies, SELF, SISOP, Rising Stars and Voyager, managed ₹3,488.84 crore between them at 30 September 2026 (our sum of APMI figures). Darshan Engineer manages all four, and the minimum investment is ₹50 lakh.
Over one year to 30 September 2026, the four returned between 24.32% and 43.65% (APMI), while the BSE 500 TRI returned -2.3% (Sundaram). Over five years the range was 13.53% to 15.06% a year, against 8.9% for the index. At 30 September, Rising Stars had 90% of its model portfolio in small caps, and Voyager had 40% in large caps.
Returns come from APMI, the Association of Portfolio Managers in India. Portfolio details come from Sundaram’s September 2026 product notes and strategy presentations, and its Disclosure Document of 17 August 2026.
Sundaram PMS strategies at a glance
| Strategy | SELF | SISOP | Rising Stars | Voyager |
|---|---|---|---|---|
| Full name | Sundaram Emerging Leadership Fund | Sundaram India Secular Opportunities Portfolio | Sundaram Rising Stars | Sundaram Voyager |
| Focus | Mid and small caps | Concentrated multi-cap | Small caps | Across market caps |
| Launched | June 2010 | February 2010 | November 2009 | November 2016 |
| AUM (APMI, 30 Sep 2026) | ₹1,066.07 crore | ₹2,027.46 crore | ₹173.61 crore | ₹221.70 crore |
| Number of stocks | Around 25 | Around 18 to 22 (target) | Around 25 | 20 to 25 (target) |
| Large / mid / small cap / cash | 21% / 27% / 46% / 6% | 38% / 34% / 25% / 3% | Not shown / 7% / 90% / 2% | 40% / 31% / 27% / 2% |
| Weighted average market cap | ₹63,658 crore | ₹1,38,988 crore | ₹18,960 crore | ₹1,50,187 crore |
| Benchmark | BSE 500 TRI | BSE 500 TRI | BSE 500 TRI | BSE 500 TRI |
| Second benchmark | Nifty Midcap 150 | None | Nifty Smallcap 250 | None |
| Sundaram’s suggested horizon | Above 3 years | Above 3 years | Above 5 years | Above 3 years |
| Fund manager | Darshan Engineer | Darshan Engineer | Darshan Engineer | Darshan Engineer |
| Minimum | ₹50 lakh | ₹50 lakh | ₹50 lakh | ₹50 lakh |
Information as of 30 September 2026, as disclosed in Sundaram’s product notes and strategy presentations (September 2026) and on APMI. Market-cap and sector figures are for Sundaram’s model client portfolio and may not add to 100% because of rounding. The minimum comes from Sundaram’s Disclosure Document (17 August 2026). The Disclosure Document and PMS agreement govern the terms.
Each strategy runs as a separate account in your name, so you see every holding and the gains count as your own. The BSE 500 TRI is the BSE 500 index with dividends reinvested. In SEBI’s classification, large caps are the 100 largest listed companies by market value, mid caps the next 150 and small caps the rest.
Sundaram PMS performance against the BSE 500 TRI
Since launch, the four have returned 14.81% to 18.35% a year (APMI), against 11.7% to 13.5% a year for the BSE 500 TRI over the same periods (Sundaram).
| Period to 30 Sep 2026 | SELF | SISOP | Rising Stars | Voyager | BSE 500 TRI (Sundaram) |
|---|---|---|---|---|---|
| 1 year | 33.73% | 25.55% | 43.65% | 24.32% | -2.3% |
| 3 years (% a year) | 22.49% | 23.80% | 18.05% | 22.31% | 9.2% |
| 5 years (% a year) | 13.53% | 14.52% | 15.06% | 13.70% | 8.9% |
| Since launch (% a year) | 17.97% | 18.35% | 15.30% | 14.81% | See next row |
| BSE 500 TRI since each launch (Sundaram, % a year) | 11.7% | 12.1% | 11.7% | 13.5% |
Strategy returns as reported to APMI for 30 September 2026: time-weighted, at aggregate portfolio level. BSE 500 TRI figures as disclosed in Sundaram’s September 2026 product notes. On its own calculation, Sundaram’s product note shows Voyager at 15.0% a year since launch. Past performance does not indicate future returns.
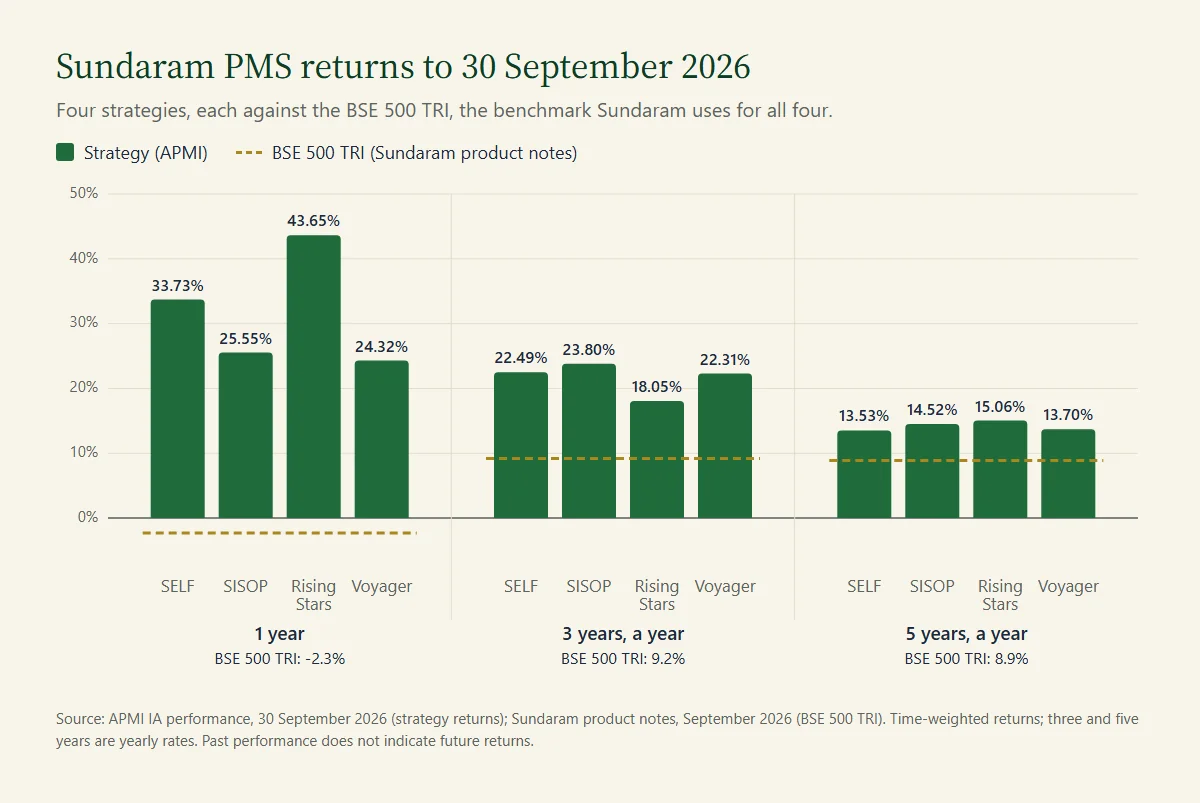
Rising Stars’ 43.65% one-year return includes 38.74% in the six months to September (APMI). September itself brought falls of 2.82% to 6.98% across the four (APMI), against a 5.6% fall in the BSE 500 TRI (Sundaram).
SELF and Rising Stars also report against a second, size-matched index. Over five years, SELF returned 13.5% a year against 14.0% for the Nifty Midcap 150. Over ten years, Rising Stars returned 12.8% a year against 13.7% for the Nifty Smallcap 250.
| Against the second benchmark (Sundaram, % a year to Sep 2026) | 1 year | 3 years | 5 years | 10 years |
|---|---|---|---|---|
| SELF | 33.7% | 22.5% | 13.5% | 16.5% |
| Nifty Midcap 150 | 3.9% | 13.0% | 14.0% | 15.7% |
| Rising Stars | 43.6% | 18.1% | 15.1% | 12.8% |
| Nifty Smallcap 250 | 6.6% | 13.3% | 13.7% | 13.7% |
As disclosed in Sundaram’s September 2026 product notes, rounded to one decimal by Sundaram.
Sundaram also shows what ₹1 crore invested at each launch had become by September 2026:
| ₹1 crore invested at launch | SELF (June 2010) | SISOP (Feb 2010) | Rising Stars (Nov 2009) | Voyager (Nov 2016) |
|---|---|---|---|---|
| Strategy | ₹14.7 crore | ₹16.4 crore | ₹11 crore | ₹3.9 crore |
| BSE 500 TRI | ₹6.1 crore | ₹6.7 crore | ₹6.5 crore | ₹3.5 crore |
As disclosed in Sundaram’s September 2026 product notes.
How the four strategies differ by company size
Rising Stars and Voyager sit at opposite ends on company size. Their weighted average market caps, the average company size weighted by each holding, are ₹18,960 crore and ₹1,50,187 crore. SELF, at ₹63,658 crore, had 46% in small caps and 27% in mid caps at 30 September 2026.
SISOP and Voyager have similar size mixes. Sundaram runs SISOP as a concentrated portfolio of 18 to 22 stocks. It splits Voyager between structural growth stories and cyclical or turnaround opportunities.
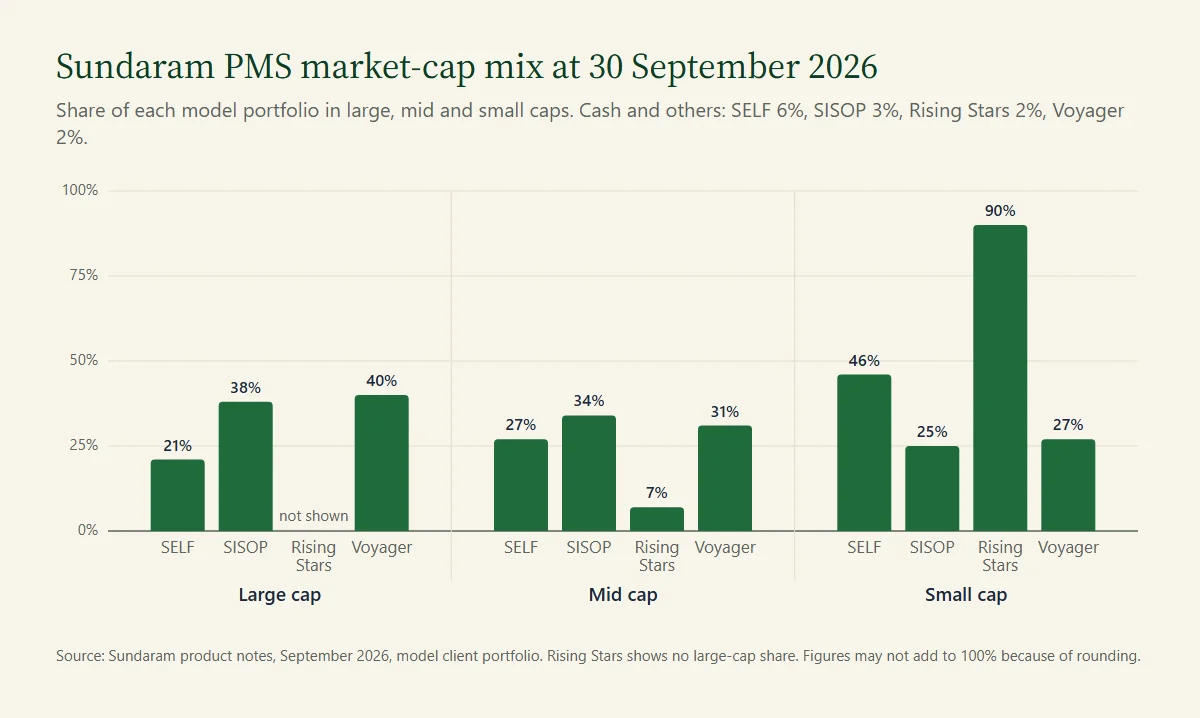
Capital goods is the largest sector in SELF (32.8%), SISOP (36.6%) and Voyager (34.5%). In Rising Stars, financial services leads at 27.0%, followed by capital goods (22.8%) and healthcare (22.2%).
Sundaram SELF PMS for mid and small caps
SELF, the Sundaram Emerging Leadership Fund, buys mid- and small-cap companies that Sundaram expects to grow into larger ones. Its product note lists stocks with a market cap below ₹800 billion (₹80,000 crore). It started in June 2010 and managed ₹1,066.07 crore at 30 September 2026.
Sundaram’s “EASE” filter spells out what it wants. E stands for emerging leaders with clean promoters (the founders or controlling shareholders). A stands for asset-light businesses with high returns on capital, S for scalable companies and E for excellent cash conversion.
The five largest holdings at 30 September 2026 were TD Power Systems, MTAR Technologies, BHEL, Acutaas Chemicals and Neuland Laboratories.
Sundaram SISOP PMS, the India Secular Opportunities Portfolio
SISOP aims for capital growth across market cycles from a concentrated portfolio of around 18 to 22 stocks. Sundaram started it in February 2010, and it managed ₹2,027.46 crore at 30 September 2026.
Its product note lists companies with growth opportunities above 15%, strong cash flows from the business and low debt. Its top five holdings were MTAR Technologies, TD Power Systems, GE Vernova T&D India, Titan and Neuland Laboratories. Capital goods made up 36.6% and financial services 23.6%.
Sundaram Rising Stars PMS for small caps
Rising Stars (APMI lists it as Sundaram Rising Star PMS) invests in small-cap companies. Sundaram started it in November 2009, and it managed ₹173.61 crore at 30 September 2026. Sundaram suggests a horizon above five years for this strategy.
Its top five holdings were TD Power Systems, MTAR Technologies, Acutaas Chemicals, Neuland Laboratories and Ujjivan Small Finance Bank. Financial services, capital goods and healthcare together made up 72.0% (our sum).
In 2018, Rising Stars fell 26.9%, when the BSE 500 TRI fell 1.8%. The calendar-year table below shows each year since.
Sundaram Voyager PMS across market caps
Voyager moves between large, mid and small caps and targets 20 to 25 stocks. Sundaram splits these into structural growth stories and cyclical or turnaround opportunities. Since its November 2016 start, it has returned 14.81% a year (APMI), against 13.5% for the BSE 500 TRI (Sundaram).
At 30 September 2026, its top five holdings were MTAR Technologies, Neuland Laboratories, GE Vernova T&D India, BHEL and Cholamandalam Investment and Finance. Sundaram puts Voyager’s since-launch down-capture ratio at 109.7 and its up-capture at 110.0. A down-capture above 100 means it fell more than the index, on average, in periods when the index fell.
Calendar-year returns and risk measures
Sundaram’s calendar-year tables show years with losses for each strategy. The table shows every year from 2017, Voyager’s first full year.
| Calendar year | SELF | SISOP | Rising Stars | Voyager | BSE 500 TRI |
|---|---|---|---|---|---|
| 2017 | 41.8% | 24.0% | 48.6% | 26.1% | 37.6% |
| 2018 | -11.6% | -4.3% | -26.9% | -8.4% | -1.8% |
| 2019 | 6.5% | 15.4% | -1.3% | 15.2% | 9.0% |
| 2020 | 31.4% | 25.2% | 13.6% | 10.3% | 18.4% |
| 2021 | 46.3% | 36.2% | 54.7% | 44.4% | 31.6% |
| 2022 | -6.8% | -6.9% | -0.2% | -5.6% | 4.8% |
| 2023 | 22.8% | 19.6% | 19.5% | 18.4% | 26.5% |
| 2024 | 23.2% | 31.4% | 7.9% | 33.9% | 15.8% |
| 2025 | 6.8% | 10.9% | 6.2% | 5.9% | 7.6% |
| 2026 to September | 26.0% | 19.2% | 35.7% | 18.8% | -7.0% |
As disclosed in the calendar-year tables of Sundaram’s September 2026 product notes. Past performance does not indicate future returns.
Sundaram also publishes risk measures since each launch, so the benchmark figures differ by strategy. Standard deviation shows how widely returns swing, and beta how far a strategy moves with the index. The Sharpe ratio measures return per unit of risk. Our guide to PMS performance metrics explains each measure.
| Since launch (Sundaram) | SELF | SISOP | Rising Stars | Voyager |
|---|---|---|---|---|
| Standard deviation (strategy / BSE 500 TRI) | 15.6 / 15.9 | 16.2 / 15.9 | 15.8 / 15.9 | 16.9 / 16.0 |
| Beta | 0.8 | 0.8 | 0.7 | 0.9 |
| Sharpe ratio (strategy / BSE 500 TRI) | 0.7 / 0.3 | 0.7 / 0.4 | 0.5 / 0.3 | 0.5 / 0.4 |
| Up-capture ratio | 106.2 | 104.3 | 96.3 | 110.0 |
| Down-capture ratio | 78.1 | 75.1 | 75.6 | 109.7 |
As disclosed in Sundaram’s September 2026 product notes.
Who manages the four strategies and how stocks are picked
One fund manager and one method run all four strategies. Darshan Engineer uses what Sundaram calls “3Q”: quality of business, quality of financials and quality of management. Sundaram’s documents do not say since when he has managed each strategy.
Sundaram’s September 2026 presentation credits him with over 16 years in financial markets. That includes 14 years in equities and 2 in credit ratings, with credit research roles at CRISIL. He has worked at Alchemy Capital, Karma Capital and Valuequest, focused on small and mid caps. Karthik Athreya is Managing Director of Sundaram Alternates. The firm also runs credit funds such as Sundaram ECCO II, a Category II AIF that lends to mid-market companies.
The SELF presentation sets the financial tests. Sundaram looks for a return on invested capital (profit relative to the capital a business uses) of at least 15%. It wants operating cash flow above half of EBITDA, debt below half of equity and the ability to double earnings in four to five years.
Risks in Sundaram’s September 2026 notes
Sundaram’s notes say: “We face risk from high concentration on a few sectors like capital goods and NBFCs.” The firm adds that capital goods valuations have run up, which raises the downside if regulation or competition from Chinese firms hits the sector. For non-banking finance companies (NBFCs), it says a new round of asset-quality problems could mean significant downside risk to its positions.
The notes also flag market-cap risk. In volatile markets, Sundaram says, small and mid caps tend to fall more than large caps. That leaves its portfolios at higher risk of drawdowns, or falls from a peak, than the more large-cap benchmark.
The four strategies also share holdings. MTAR Technologies and Neuland Laboratories appear in the top five of all four, and TD Power Systems in three (our count).
Fees and how to start with Sundaram PMS
Sundaram offers one fee option on these four strategies: a fixed management fee of 2.5% a year plus GST, with no performance fee. On the ₹50 lakh minimum, that is ₹1.25 lakh a year before GST. Sundaram’s Disclosure Document (17 August 2026) also lists other costs, such as custody, brokerage and transaction charges, and exit loads. Request a call back and we will take you through the fees and the paperwork before you start. Our explainer on PMS fee structures covers fixed and performance fees in general.
Sundaram PMS: questions investors ask
Minimum, process and your own returns
What is the minimum investment in Sundaram PMS?
₹50 lakh, in cash or securities, as Sundaram’s Disclosure Document states. The minimum does not apply to accredited investors, for whom Sundaram sets its own amount; ask us. Our note on the ₹50 lakh PMS minimum explains how that amount works.
How do I invest in Sundaram PMS?
You complete KYC, read Sundaram’s Disclosure Document and sign the PMS agreement for one strategy. You then fund the account, and Sundaram builds the portfolio in your name.
Will my returns match the figures above?
Not exactly. APMI’s figures are time-weighted and measured across all of a strategy’s accounts together. Market-cap and sector figures describe Sundaram’s model client portfolio. Your account’s return depends on when you invest and how Sundaram builds your portfolio.
Performance, NRIs, tax and assured returns
Where can I check Sundaram PMS performance?
APMI publishes monthly returns for each PMS investment approach, with the period and as-of date.
Can NRIs invest in Sundaram PMS?
Sundaram’s September 2026 documents do not set out terms for NRIs. Our guide to PMS for NRIs explains how an onshore PMS account generally works. If you live abroad, ask a tax professional how your country treats gains from Indian shares.
How are PMS gains taxed?
You own the shares directly, so each sale in your account counts as your own capital gain. Under current rules for FY 2026-27, short- and long-term capital gains tax may apply to each sale. Confirm your own position with a tax professional.
Are Sundaram PMS returns assured?
No. Sundaram’s documents state that PMS clients are not offered any guaranteed or assured returns.
Sundaram PMS: four strategies under one manager
Sundaram PMS offers four portfolios of Indian shares under one manager, from Voyager’s 40% in large caps to Rising Stars’ 90% in small caps. Each needs ₹50 lakh and, on Sundaram’s guidance, more than three years, or five for Rising Stars. Our PMS investments page lists all four with their latest APMI returns.
