

Debt PMS in India: How It Works, Costs, Tax and Risks
A debt PMS is a portfolio management service that buys bonds and debentures for you, in your own demat account. A SEBI-registered portfolio manager runs it. You invest at least ₹50 lakh, because that is SEBI’s minimum for a PMS account. The manager picks the issuers, ratings and maturities inside a stated strategy and reports to you every month.
Managers pitch debt PMS as the step up from fixed deposits and debt mutual funds. The offer is a higher yield, a portfolio you can see bond by bond, and terms built for a larger cheque. That raises the question this guide works through. What does an investor give up to earn the extra yield: credit quality, liquidity, tax timing or fees?
The answer depends on the strategy. So this guide uses three live debt PMS strategies as worked examples, alongside SEBI and APMI data and SEBI’s new rules for portfolio managers. Industry data runs to 31 August 2026. Strategy returns come from APMI and SEBI monthly filings (August and September 2026), and strategy terms from the managers’ July and August 2026 documents.
Debt PMS at a glance
| Particular | Detail |
|---|---|
| What you own | Bonds, NCDs, commercial paper and similar securities held directly in your name |
| Regulator | SEBI (the portfolio manager must hold a SEBI PMS registration) |
| Minimum investment | ₹50 lakh (some managers ask for more, e.g. ₹1 crore) |
| Typical holdings | Corporate bonds and NCDs, often NBFC issuers, rated AAA to BBB depending on the strategy |
| Liquidity | Redemption on request, paid within 7 to 45 days in the examples below, with exit loads of 1% to 2% in the first year or two |
| Fees | Fixed management fee (about 0.75% to 1.50% a year in the examples below), plus operating costs and GST |
| Tax | Interest at your slab rate; gains taxed by holding period and instrument, as each bond is sold or matures |
Information as of October 2026. Sources: SEBI; manager documents named in the text.
Put simply, you give a professional ₹50 lakh or more to run your own bond portfolio. You can usually withdraw within weeks, although an early exit can cost 1% to 2%. The main risk is that a company you lend to pays late or defaults. Its bonds also tend to lose value well before that.
What you own, and how the manager earns the yield
The difference from a fund comes down to ownership. In a debt mutual fund you own units of a pooled scheme, while in a debt PMS the bonds sit in a demat account in your name, held by a custodian. Your statement then shows each issuer, its rating, coupon and maturity.
Most managers offer debt PMS on a discretionary basis, which means you sign the agreement and the manager then makes each buy and sell decision. A few also run non-discretionary accounts, where you approve each trade.
The manager earns the yield in two ways. First, there is coupon income from holding bonds to maturity. Second, there is trading. The manager buys a bond that looks cheap for its credit quality, then sells after a rating upgrade or a price rise. Sundaram’s F.I.R.S.T presentation (July 2026) describes exactly this mix of a hold-to-maturity book and “an opportunistically managed trading strategy”.
Debt PMS by the numbers: what SEBI and APMI data show
Headline figures can mislead here. SEBI’s Report of Portfolio Managers puts total PMS assets at ₹44,34,593 crore as on 31 August 2026. Plain debt also makes up most discretionary assets: ₹26,96,883 crore listed and ₹5,02,340 crore unlisted.
Almost all of that debt belongs to provident funds. The same report shows ₹31,91,753 crore of PMS assets coming from EPFO and PF mandates, against ₹9,18,517 crore from all other clients. So the “debt dominates PMS” headline describes retirement-fund mandates. It says little, however, about HNI money in debt PMS strategies.
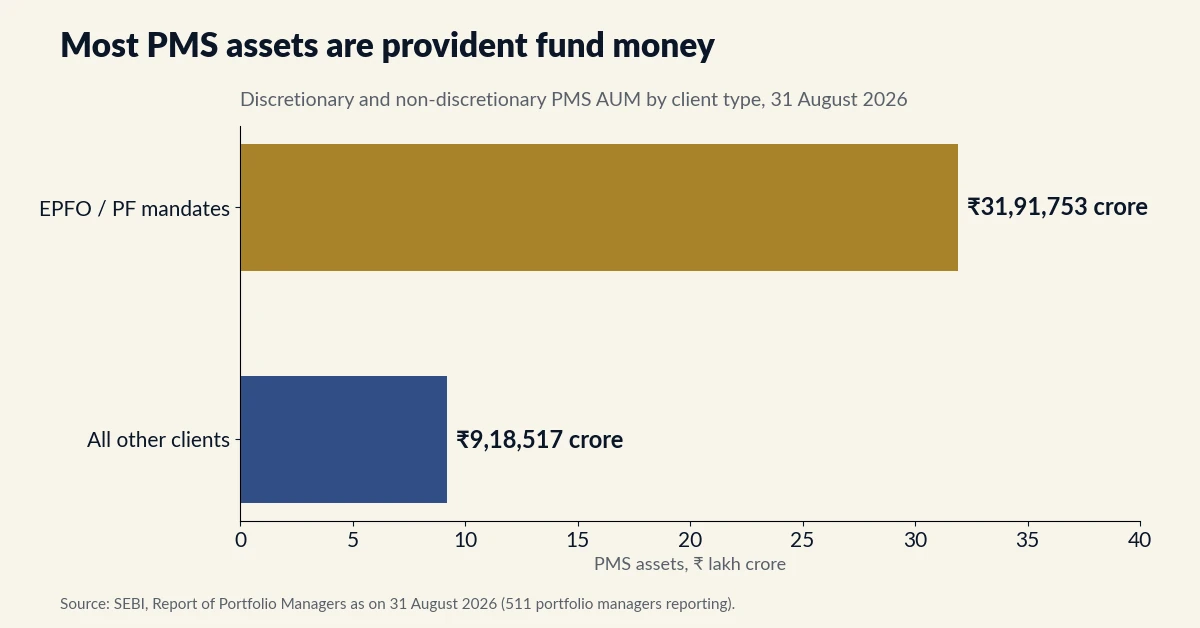
APMI’s PMS Industry Compendium for August 2026 tells the same story. Industry AUM stood at about ₹44.35 lakh crore across 2,25,826 client accounts. Plain debt formed 85.19% of discretionary AUM, and PF and EPFO money also made up about 79% of domestic AUM. Our note on PMS AUM and growth in India tracks the wider trend.
For an individual investor, that leaves no clean industry figure for HNI debt PMS assets. The useful data sits at strategy level: what each manager buys, at what rating, for how long, and at what cost.
How managers build a debt PMS: three live strategies
The three strategies below are all debt PMS offerings, and they show how far the designs differ. The table compares structure only; each strategy’s returns appear separately, against its own benchmark, below the table.
| Sundaram F.I.R.S.T | Neo Yield Enhancer | Phillip Conservative Credit Portfolio | |
|---|---|---|---|
| Portfolio manager | Sundaram Alternate Assets | Neo Alternative Asset Managers | PhillipCapital (India) |
| Service type | Debt PMS (three variants) | Discretionary PMS | Debt PMS |
| Strategy AUM (latest reported) | ₹217 crore across the three variants (30 Sep 2026) | ₹2,293 crore (30 Sep 2026) | ₹202.21 crore across two options (30 Sep 2026) |
| Rating band | AAA to BBB, listed and rated only | AAA to A- for 80% to 100% of holdings | AA+ to A- |
| Duration or maturity | Average duration 2.5 to 3 years | Duration 1 to 2 years; suggested holding 6 to 9 months | Average maturity 4.52 years; modified duration 3.14 |
| Yield as printed | Targeted yield 9.10% / 10.10% / 11.40% (indicative) | Not stated as a portfolio yield | YTM 10.75% |
| Minimum | ₹50 lakh | ₹1 crore | ₹50 lakh |
| Management fee | 0.75% / 1.00% / 1.50% a year, plus GST | 1.25% a year below ₹15 crore, on commitment; operating expenses 0.10% | Not disclosed |
| Exit load | 1% in year 1 (Conservative, Moderate); Aggressive 2% in year 1, 1% in year 2 | 1% within 3 months; nil after | 1% within 12 months; nil after |
| Payout on exit | Securities within 15 days; cash within 45 days | Within 7 working days of notice | Not stated |
| Income option | Periodic coupon payout | 2.00% cash flow each quarter | Growth and Regular Income options |
Information as of October 2026. Sources: Sundaram F.I.R.S.T presentation, July 2026; Neo Yield Enhancer DPMS presentation, August 2026; PhillipCapital Fixed Income PMS factsheet, July 2026; AUM from APMI and SEBI monthly data.
Inside each debt PMS strategy
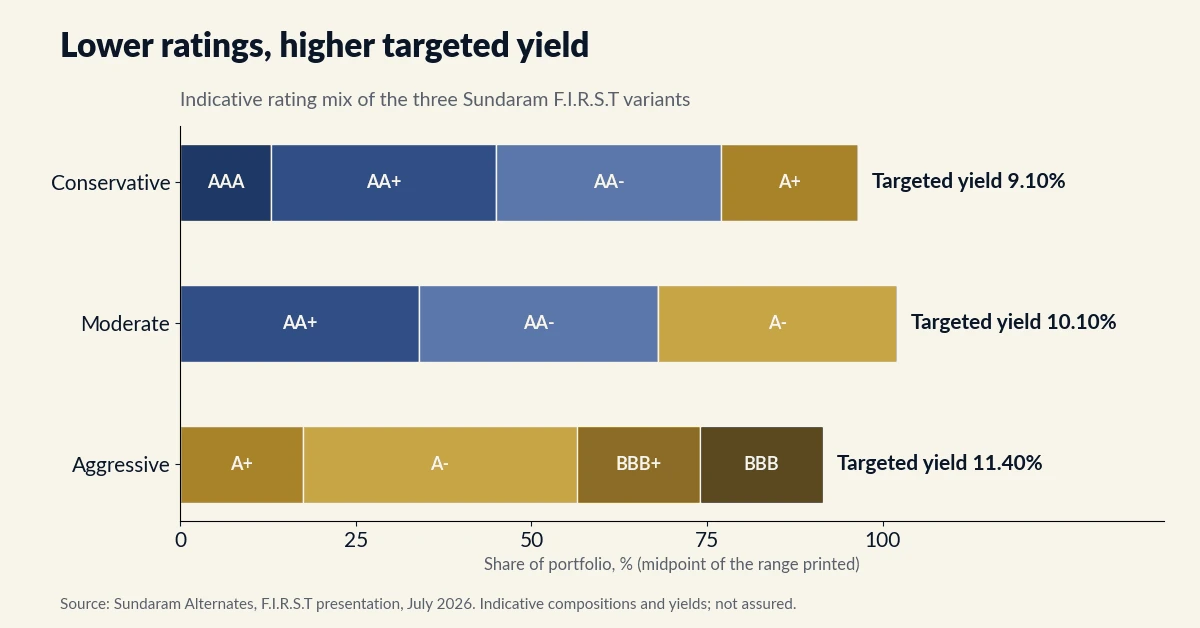
Sundaram F.I.R.S.T runs three versions of one idea. The Conservative variant holds 12-14% in AAA paper and nothing below A+. The Aggressive variant, by contrast, holds nothing above A+, with up to 15-20% each in BBB+ and BBB. The manager names vehicle finance, gold loan, MFI, MSME lending and diversified NBFCs as its issuer sectors.
Neo Yield Enhancer targets 50% to 75% of its core portfolio in bonds of “alternative NBFCs”. These lend to borrowers such as consumers, used commercial vehicle buyers, affordable housing buyers and MSMEs. Neo scores issuers on six weighted factors, led by capitalisation (25%) and governance (20%). It also prefers credit durations of 18 to 24 months. Its presentation lists 12 rating upgrades in the portfolio since inception.
Phillip Conservative Credit Portfolio buys mid-to-large NBFCs, housing finance companies and state-owned entities. The July 2026 factsheet sets limits. For example, it avoids real estate, commodity and stressed companies, caps fintech and MFI exposure at 20%, and keeps at least half the book in secured businesses.
Reported returns, each against its own benchmark
The figures below come from the managers’ monthly filings, as published by APMI and SEBI. They are TWRR returns, shown as printed. All the strategies below are shown at 30 September 2026.
| Strategy (as on) | 1 year | Since inception | Benchmark: 1 year / since inception |
|---|---|---|---|
| Sundaram FIRST Conservative (30 Sep 2026) | 7.63% | 8.64% | CRISIL Composite Bond Fund Index: 3.81% / 5.86% |
| Sundaram FIRST Moderate (30 Sep 2026) | 8.35% | 9.55% | CRISIL Composite Bond Fund Index: 3.81% / 6.01% |
| Sundaram FIRST Aggressive (30 Sep 2026) | 9.10% | 10.51% | CRISIL Composite Bond Fund Index: 3.81% / 6.13% |
| Strategy (as on) | 1 year | Since inception | Benchmark: 1 year / since inception |
|---|---|---|---|
| Neo Yield Enhancer (30 Sep 2026) | 10.38% | 11.17% | Nifty Medium to Long Duration Debt Index: 0.08% / 4.90% |
| Strategy (as on) | 6 months | Since inception | Benchmark: 6 months / since inception |
|---|---|---|---|
| Phillip Conservative Credit, Growth (30 Sep 2026) | 5.56% | 10.41% | CRISIL Composite Bond Fund Index: 3.10% / 3.41% |
| Phillip Conservative Credit, Regular Income (30 Sep 2026) | 5.59% | 12.60% | CRISIL Composite Bond Fund Index: 3.10% / 3.22% |
Information as of 17 October 2026, from APMI Investment Approach Wise Performance and the SEBI Portfolio Manager Monthly Report. Phillip Conservative Credit started in October 2025, so it has no one-year figure yet.
Sundaram’s three variants line up with their rating mix: the Conservative book returned least over one year and the Aggressive book most. Past performance as reported by each manager; however, it does not predict future returns, and individual accounts differ by entry date. Our guide to PMS performance metrics covers TWRR and other ways to read PMS returns.
The yield trade-off: ratings, duration and exit terms
Each extra point of yield in a debt PMS comes from somewhere. Sundaram’s own table makes the link plain. As the mix moves from AAA and AA paper towards A- and BBB, the targeted yield rises from 9.10% to 11.40%. That 2.3-point gap therefore pays for a higher chance of default and for bonds that are harder to sell.
Duration works differently. A short-duration book, such as Neo’s one to two years, moves less when interest rates change and returns cash sooner. A longer book, such as Phillip’s (modified duration 3.14), locks in yields for longer but loses more if rates rise.
Exit terms tell you how the manager expects to run the money. A 2% exit load in the first year, as on Sundaram’s Aggressive variant, means ₹1 lakh on a ₹50 lakh exit. Neo, on the other hand, drops its exit load after three months. It warns that leaving within six to nine months may mean lower returns.
What a debt PMS costs on ₹50 lakh
Fees matter more in debt than in equity because the starting yield is lower. Take ₹50 lakh in Sundaram’s Moderate variant: an indicative yield of 10.10% and a 1.00% management fee.
| Item | Amount a year |
|---|---|
| Portfolio income at a 10.10% yield | ₹5,05,000 |
| Management fee at 1.00% | ₹50,000 |
| GST on the fee at 18% | ₹9,000 |
| Income after fee and GST | ₹4,46,000 (8.92%) |
Illustrative only. It assumes a steady ₹50 lakh portfolio that earns the full indicative yield. It leaves out operating expenses, which Sundaram charges at actuals. Sundaram does not assure the yield.
The fee and GST take about 1.18 percentage points, close to a tenth of the gross income. Operating expenses, custody charges and any exit load also come on top. Neo charges its fee on commitment, so the base can differ from the current portfolio value. Our explainer on PMS fee structures covers fixed and performance fees in more detail.
Debt PMS taxation: when you pay and at what rate
In a debt PMS you own each bond, so you pay tax on each coupon and each sale as it happens. A mutual fund, by contrast, defers tax until you redeem your units. That timing difference matters as much as the rates.
For FY 2026-27, the main rules for an individual:
- You pay tax on coupon and interest income at your slab rate.
- Listed bonds held for more than 12 months give long-term gains. The Income Tax Department sets the rate at 12.5%, without indexation.
- Listed bonds held for 12 months or less give short-term gains, taxed at your slab rate.
- Gains on unlisted bonds and debentures, and on market-linked debentures, count as short-term whatever the holding period, including when they are redeemed or mature.
A strategy that mostly holds bonds to maturity earns mostly interest, taxed at slab. One that trades often, however, creates more short-term gains. Before you invest, ask the manager for last year’s split between interest, short-term and long-term gains. A tax professional can then confirm how the rules apply to you. NRIs face withholding tax and repatriation questions, covered in our page on PMS for NRIs.
Debt PMS vs debt mutual fund, FD and bonds
| Feature | Debt PMS | Debt mutual fund | Bank FD | Direct bonds |
|---|---|---|---|---|
| What you own | Bonds in your own demat | Units of a pooled fund | A deposit with the bank | Bonds you pick yourself |
| Minimum | ₹50 lakh | ₹500 | Usually small | One bond’s face value |
| Who chooses the bonds | The portfolio manager | The fund manager | Not applicable | You |
| Liquidity | Days to weeks; exit load early on | Usually a few days | Premature withdrawal, often with a penalty | Depends on market demand |
| Tax timing | Each coupon and sale | On redemption of units | Interest each year | Each coupon and sale |
| Tax on gains | By holding period and instrument | Most units bought since April 2023 at slab | Not applicable | By holding period and instrument |
| Cost | Fixed fee, expenses, GST | Expense ratio within the NAV | None shown | Brokerage and spreads |
Information as of October 2026. Tax rules apply to individual resident investors for FY 2026-27.
Choosing comes down to three questions. Do you want to see and own each bond, and does a ₹50 lakh minimum fit your total portfolio? Can you accept lower-rated issuers for a higher yield? And would you prefer to pay tax as you go, or defer it inside a fund? A debt mutual fund gives daily pricing, wide diversification and tax deferral. A debt PMS instead gives ownership, issuer-level reporting and a focus on fewer names.
Some investors also look at Category II credit AIFs, which lend to unlisted companies for fixed terms. Our article on private credit AIFs explains how those differ from a listed-bond PMS.
Risks to check before you sign
Credit risk comes first. If an issuer defaults, the loss hits your account directly. A debt PMS also usually holds far fewer names than a debt fund. PhillipCapital’s older Income Builder Portfolio, for example, had deployed its latest tranche across 7 to 9 issuers, per its July 2026 factsheet. Check the largest single-issuer and single-sector weights before you invest.
Liquidity risk follows. Lower-rated NCDs trade thinly, so a manager may struggle to sell at a fair price in a stressed market. Exit timelines of 15 to 45 days, and payouts in securities, also reflect that.
Interest rate risk depends on duration: rising yields cut bond prices, more so for longer-duration books. Valuation is also a quieter risk. Agencies set prices for thinly traded bonds. Neo, for instance, moved from ICRA-based prices to NSE’s valuation framework.
Concentration in NBFCs is common to all three strategies above. A shock to NBFC funding would therefore hit them together, whatever the individual ratings say. Our PMS selection checklist lists the questions to put to any manager.
What changes under SEBI’s 2026 PMS rules
SEBI’s Board approved new SEBI (Portfolio Managers) Regulations on 24 September 2026, according to its press release. Published copies of the notified text give an effective date of 1 April 2027; until then the current rules apply.
Two changes touch debt PMS directly. Managers will be able to buy bonds in primary issues, not only listed bonds in the market. SEBI’s Board has also approved up to 10% of a client’s money in unlisted, investment-grade debt under a discretionary PMS, with the client’s consent; a SEBI circular will set the exact limit. That widens the choice of bonds, and it also brings the tax and liquidity profile of unlisted debt into the portfolio.
The new ₹25 lakh minimum applies only to PRIM, a separate route for portfolio managers investing in mutual fund units. A regular debt PMS account still needs ₹50 lakh. Accredited investors can invest lower amounts; ask us.
Debt PMS questions investors ask
Are debt PMS returns guaranteed? No. Managers state target or indicative yields, and every manager document reviewed here says it does not assure returns. Defaults, rate moves and fees can all reduce what you receive.
Can an NRI invest in a debt PMS? Many managers accept NRIs, though onboarding takes longer. Neo’s presentation notes different account-opening timelines for NRIs. Tax comes off at source on NRI income, so ask a tax professional how that fits with your home country’s tax.
How soon can I get money out? From about a week to 45 days. Neo pays within 7 working days; Sundaram within 15 days in securities or 45 days in cash. Exit loads may apply in the first year or two.
Is debt PMS safer than equity PMS? Prices usually move less, but the risks differ. A debt PMS can still lose money through defaults, and lower-rated strategies carry more of that risk.
Can I choose the bonds myself? In a discretionary debt PMS, no; the manager decides within the strategy. Some managers offer non-discretionary accounts in which you approve each trade.
A debt PMS offers a higher stated yield, direct ownership and issuer-level reporting. In exchange, an investor takes more credit and liquidity risk than in an FD. Fees and GST also cost about a percentage point a year, tax falls due as income arrives, and the minimum is ₹50 lakh. The rating band, duration and exit terms of each strategy decide how much of each you accept. Kalviro’s PMS in India page lists the strategies we track.
