

Buoyant Capital PMS vs AIF: Returns, Tax & Fit (2026)
Buoyant Capital PMS vs AIF is not a fight about which strategy is smarter. Instead, it is a choice about legal form. Buoyant Capital runs one listed-equity approach, Buoyant Opportunities, through two SEBI paths: a Portfolio Management Service and a Category III Alternative Investment Fund.
In both cases, the stock-picking idea is the same. However, ownership, tax, exit rules and ticket size all change with the form you pick.
Here is the short answer. Choose the PMS if you want stocks in your own demat and can handle personal capital-gains reporting. Prefer the AIF if you want pooled units, fund-level tax and a twice-monthly exit window. Then read the numbers as of 30 June 2026 and decide on fit, not brochure polish.
Performance below is as of 30 June 2026. Past performance does not guarantee future returns.
What Buoyant Capital is
Buoyant Capital Private Limited is a Mumbai-based investment manager founded in 2016. SEBI has registered it as a portfolio manager and as manager of a Category III AIF (PMS: INP000005000; AIF: IN/AIF3/22-23/1125). Registration detail is also on Buoyant’s disclosures page.
The firm runs more than one PMS approach (including All-Weather and Liquid). This article compares the flagship Buoyant Opportunities strategy only, because that is the book offered in both PMS and Category III AIF form. That focus keeps the comparison clean. It is also the concentration risk you accept if Opportunities is your only Buoyant exposure.
Founders
Three investment professionals built the firm:
- Jigar Mistry: equity research across BFSI, metals and mining, utilities and India strategy; formerly Director of Research at HSBC; also Kotak Institutional Equities; CA and CFA.
- Sachin Khivasara: research and investing across auto, capital goods and mid/small caps; earlier roles at Nippon AMC, Edelweiss and Enam; CA and Cost & Works Accountant.
- Viral Berawala: investing and industry roles across IT, FMCG, oil and gas and real estate; formerly CIO at Nippon Life Insurance (over USD 3 billion managed); also Nippon AMC and TCS; CA and IIM Ahmedabad alumnus.
Together they bring about 77 years of equity experience to a single strategy.
Scale and skin in the game
As of 30 June 2026, combined AUM across Buoyant’s PMS and AIF mandates sits above USD 2.0 billion (INR converted to USD). Opportunities PMS shows about 6.64% alpha over the BSE 500 TRI since inception. Founders and families also hold personal capital in the strategy.
Ignore aggregator AUM scrapes when dates or PMS-only versus PMS+AIF cuts disagree. Use the manager’s current figures for diligence.
The Buoyant Opportunities approach
Before you pick Buoyant Capital PMS vs AIF, understand the book you are buying. Structure does not create the edge. Instead, the cycle framework does.
Cycle thesis
Buoyant’s core idea is simple: a good company is not always a good investment. Stocks, sectors and market-cap buckets move in cycles. Because of that, paying peak prices for quality can trap capital for years even when earnings keep rising.
Familiar examples make the point. Coca-Cola’s price went nowhere for 19 years while earnings doubled, and Colgate India barely moved while EPS rose fourfold over 15 years. Both were strong businesses bought at poor points in their cycle.
Core–satellite construction
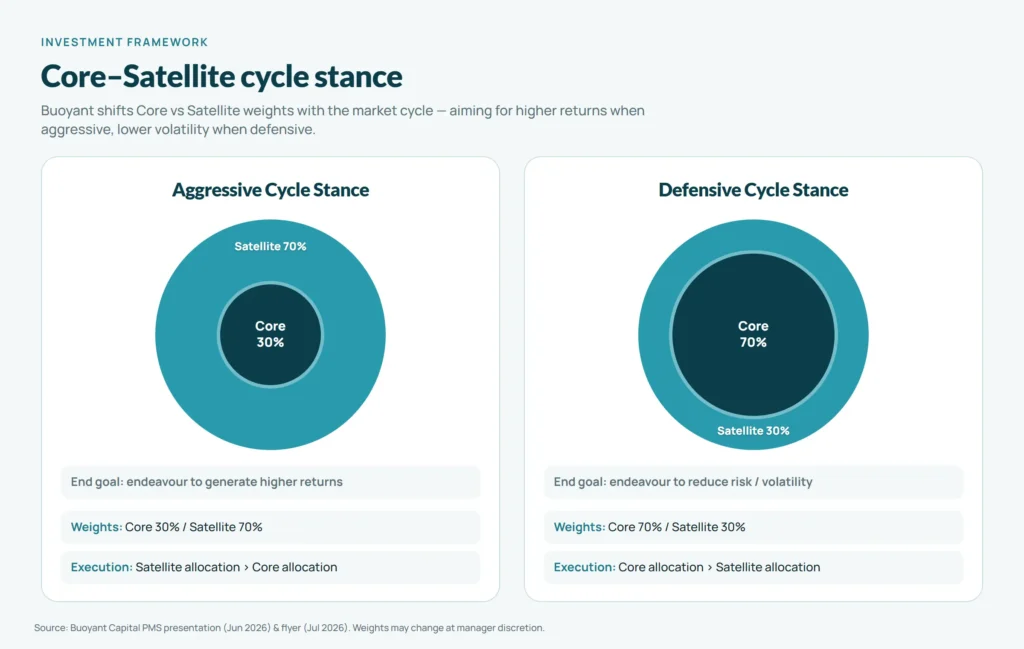
Buoyant builds the book with a Core–Satellite model and a clear “cycle stance”:
- Core: leaders that generate cash and have clearer economics.
- Satellite: cyclicals (metals, commercial vehicles, NBFCs), turnarounds and challenger businesses where the leader looks too expensive.
Weights then shift with the stance:
| Cycle stance | Core | Satellite | Intent |
|---|---|---|---|
| Aggressive | about 30% | about 70% | Seek higher return |
| Defensive | about 70% | about 30% | Seek lower volatility |
Opportunities is flexi-cap and not limited to one sector. Portfolio size and mandate wording belong in the live Disclosure Document / PPM before you commit.
How stances have performed
Five stance windows since May 2016:
| Period | Stance | Buoyant return | BSE 500 TRI |
|---|---|---|---|
| Jun 2016 – Sep 2017 | Aggressive | 63% | 29% |
| Sep 2017 – Mar 2019 | Defensive | 7% | 14% |
| Mar 2019 – Aug 2021 | Aggressive | 73% | 56% |
| Aug 2021 – Mar 2026 | Defensive | 99% | 47% |
| Mar 2026 – Jun 2026 | Aggressive | 12% | 12% |
Source: Bloomberg, Buoyant Capital analysis (June 2026 investor deck, “Across market-cycles”). Absolute returns; periods over 12 months are TWRR, net of expenses.
The book beat the benchmark in three windows, lagged in one (Sep 2017–Mar 2019 defensive), and matched it in the short latest window. That lag matters. In other words, “defensive” tries to manage risk; it does not promise to beat the index. Still, Buoyant notes it moved the stance back to Aggressive at the end of March 2026.
Valuation work uses a reverse DCF lens: how much growth is already priced in before adding or cutting a name. Some call the style GARP. However, Buoyant does not force a Growth or Value label.
Buoyant Capital PMS: structure and performance
Buoyant Opportunities PMS is a manager-run PMS. In practice, the team trades in your individual demat and trading account. As a result, you own the shares directly, not fund units.
That ownership model matches the industry PMS design outlined on the PMS page: direct holdings, personal-level tax and manager discretion. Strategy quality still differs by manager.
| Item | As disclosed |
|---|---|
| Inception | 31 May 2016 (June deck). Some July flyer footers also present the series since 1 June 2016. |
| Minimum | About ₹50 lakh (SEBI industry floor under the Portfolio Managers Regulations, 2020; confirm live docs) |
| Ownership | Direct equity in your demat |
| Benchmark | BSE 500 TRI |
| Liquidity (Opportunities PMS) | Firm materials emphasise no lock-in and no entry/exit load |
| Fees | Confirm management / performance fees and billing in the live Disclosure Document and fee schedule |
| Regulator | SEBI (INP000005000) |
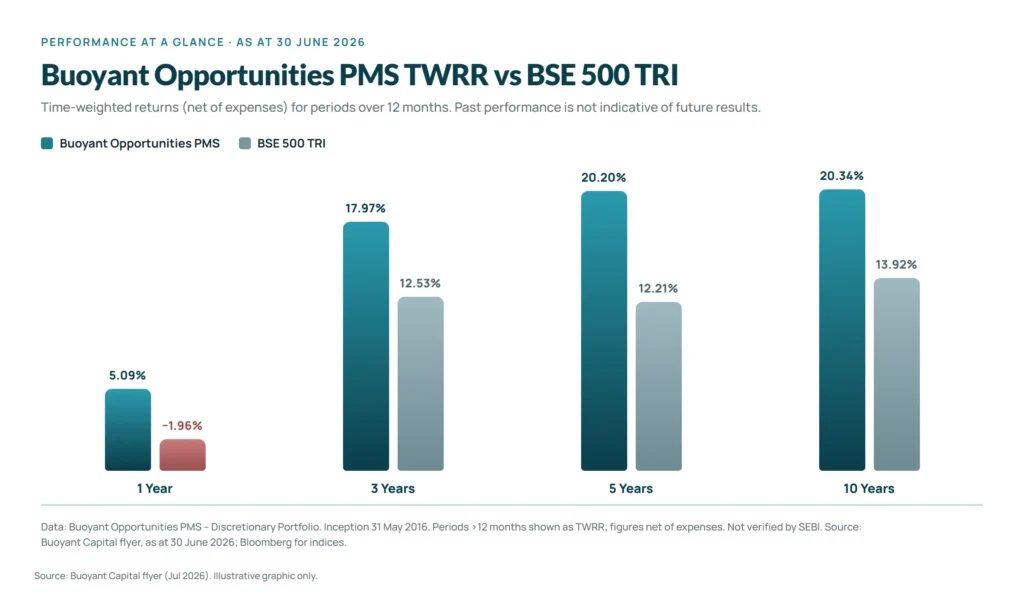
PMS performance (30 June 2026)
| Period | Buoyant TWRR | BSE 500 TRI |
|---|---|---|
| 1 year | 5.09% | -1.96% |
| 3 years | 17.97% | 12.53% |
| 5 years | 20.20% | 12.21% |
| 7 years | 21.68% | 14.38% |
| 10 years | 20.34% | 13.92% |
| Since inception (May 2016) | 20.75% | 14.11% |
Source: Bloomberg for indices; Buoyant Capital analysis for the Opportunities PMS discretionary portfolio, as at 30 June 2026 in the July 2026 flyer. TWRR figures are net of expenses. Not verified by SEBI. Past performance does not guarantee future returns.
On rolling windows since inception, Buoyant shows beat rates versus BSE 500 TRI of 64% (1-year), 82% (3-year), 96% (5-year) and 100% (7-year) in the July flyer and June deck. That is useful context for consistency. Even so, the figures are still self-reported and not SEBI-verified.
Top 5 disclosed holdings (30 June 2026): ICICI Bank, Axis Bank, State Bank of India, Bharti Airtel and Shriram Transport Finance. Only the top five are public. Meanwhile, the live book may hold more names.
For peer context across a curated PMS shelf, see top performing PMS strategies.
Buoyant Capital AIF: structure and performance
The AIF path runs the same Opportunities research inside a Category III, open-ended pool. Therefore, you hold fund units, not the stocks in your own name.
Official scheme names and inception dates are listed on Buoyant’s products and disclosures pages. The Opportunities series covered below sit under SEBI registration IN/AIF3/22-23/1125. Buoyant may list additional Opportunities-linked series on the products page; confirm live names and tickets in current docs rather than treating marketing pages as the governing record.
| Item | As disclosed (July flyer / SEBI framework) |
|---|---|
| Series I | Live since 19 Nov 2022 |
| Series II | Live since 1 Apr 2025 |
| Typical Opportunities minimum | About ₹1 crore per investor under the SEBI AIF Regulations, 2012 framework (₹25 lakh employee/director carve-out where eligible). Confirm the live series and ticket in current docs. |
| Liquidity | No entry/exit load; exit window twice a month (more liquid than many closed-ended Cat III books) |
| Tax shape | Category III tax at fund level (unlike pass-through Category I/II). Soft: model your own post-tax outcome with a CA. |
| Fees | Confirm management / performance fees and expenses in the live PPM and fee schedule |
| Returns shown below | Pre-tax, pre-expense, pre-fee at combined fund level (July flyer note) |
For Category III context as an asset class, read the AIF and best AIF funds in India.
AIF performance (30 June 2026)
Buoyant Opportunities Strategy (Series I)
| Period | Buoyant AIF CAGR | BSE 500 TRI | BSE 100 TRI | Nifty TRI |
|---|---|---|---|---|
| 1 year | 10.70% | -1.96% | -3.99% | -5.42% |
| 2 years | 10.97% | 1.52% | 1.21% | 0.85% |
| 3 years | 18.59% | 12.53% | 10.42% | 8.81% |
| Since inception (Nov 2022) | 20.10% | 12.11% | 10.34% | 8.83% |
Buoyant Opportunities Strategy II
| Period | Buoyant AIF CAGR | BSE 500 TRI | BSE 100 TRI | Nifty TRI |
|---|---|---|---|---|
| 1 year | 11.43% | -1.96% | -3.99% | -5.42% |
| Since inception (Apr 2025) | 18.21% | 9.99% | 6.61% | 4.69% |
Source: Bloomberg for indices; Buoyant July 2026 flyer for scheme returns as at 30 June 2026. Benchmarking reference only. Not verified by a regulatory agency. AIF returns are pre-tax, pre-expenses and pre-fees at consolidated fund level.
Top 5 disclosed holdings (30 June 2026):
- Series I: ICICI Bank, Axis Bank, IndiGo (InterGlobe Aviation), Bharti Airtel, Shriram Finance
- Series II: ICICI Bank, Axis Bank, Bharti Airtel, IndiGo (InterGlobe Aviation), State Bank of India
In other words, both series tilt toward large-cap financials and related names. Even so, weights and names need not match the PMS day to day.
What a ₹1 crore ticket still needs to confirm
Use this checklist before you treat Buoyant Capital PMS vs AIF as an allocation decision:
| Item | PMS | AIF (Opportunities) |
|---|---|---|
| Fixed management fee | 2% p.a. | 2% p.a. |
| Performance fee / hurdle / high-water mark | Confirm in Disclosure Document if any | Confirm in PPM if any class has it |
| Other costs | Brokerage, custody, audit as billed | Fund expenses above the fixed fee |
| Return basis in marketing | Net of expenses (TWRR) | Pre-tax, pre-expense, pre-fee |
| Liquidity | No lock-in / no entry-exit load on Opportunities PMS | Twice-monthly exit; no entry/exit load |
| Horizon | About 3–5 years or longer | About 3–5 years or longer |
| Personal tax | Capital gains in your hands | Fund-level Cat III; model with a CA |
This page is for structure screening. Final size-up still needs the live Disclosure Document or PPM, the fee schedule, and your own after-tax math.
Where Buoyant Capital PMS vs AIF fits in a portfolio
| Parameter | Buoyant Capital PMS | Buoyant Capital AIF (Cat III) |
|---|---|---|
| Minimum | ₹50 lakh (SEBI floor) | Usually ₹1 crore (SEBI floor); confirm series |
| Ownership | Stocks in your demat | Units in a pooled fund |
| Tax | Capital gains in your hands | Fund-level (Cat III) |
| Liquidity | Per PMS agreement; firm materials emphasise no lock-in / no entry-exit load on Opportunities PMS | Twice-monthly exit window; no entry/exit load |
| Reporting | Your portfolio and trades | Fund NAV and combined reporting |
| Track record length | Continuous since May 2016 | Series I from Nov 2022; Series II from 2025 |
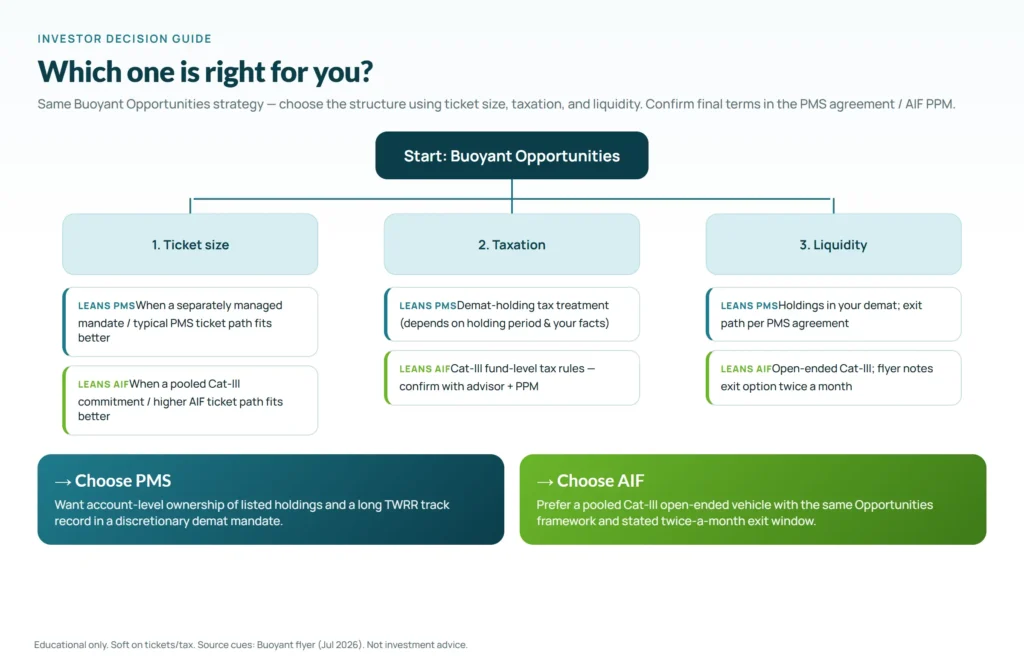
| Best when | You want holding-level visibility and accept personal tax filing | You want pooling, simpler reporting and built-in exit windows |
Neither form is simply “better.” For Buoyant Capital PMS vs AIF, decide on ticket, tax admin, liquidity rhythm and how much holding-level visibility you need.
Risk metrics on the PMS book
Returns without risk context are incomplete. Because of that, Buoyant discloses PMS risk statistics as of 30 June 2026:
| Metric | 3-year | 5-year | Since inception |
|---|---|---|---|
| Sharpe | 0.8x | 0.9x | 0.6x |
| Jensen’s alpha | 6.1% | 8.4% | 7.8% |
| Beta vs benchmark | 0.90x | 0.94x | 1.01x |
| Standard deviation | 14.5% | 15.4% | 6.8% |
| R-squared | 0.85 | 0.76 | 0.77 |
Source: India Buoyant Capital PMS June 2026 deck, Performance highlights / Risk metrics table (as at 30 June 2026).
A 3-year beta near 0.9x implies slightly lower volatility than the BSE 500 in that window, alongside higher returns. Since-inception standard deviation for the portfolio is 6.8%, versus 16.8% for the benchmark over the same period. That is the widest gap of any window shown, largely a function of the multi-year defensive stance the book held for most of 2022–2025. The 7-year window (24.5% portfolio vs 18.3% benchmark) captures a shorter, more volatile stretch and should not be read as the inception figure. Treat every window as period-specific. Consequently, metrics will move when stance and markets change.
Who should consider Buoyant Capital PMS vs AIF
Likely fit
- HNIs / UHNIs already above the SEBI PMS or AIF minimums who want active, cycle-aware equity rather than a broad mutual fund.
- Investors who accept that cycles are managed, not ignored.
- Allocators comfortable with a focused Opportunities mandate: that focus can be a strength or a single point of failure.
- Family offices and NRIs who want a regulated India-equity path and will check first whether they qualify.
NRIs should confirm FEMA and rules on sending money abroad via the RBI FEMA notifications and adviser counsel. In addition, Category III fund-level tax can change the NRI outcome versus headline CAGR.
Who should skip
- Anyone below SEBI ticket thresholds.
- People who need daily mutual-fund-style liquidity.
- Readers who dislike focused, high-conviction books.
If you want a peer PMS read for process contrast, the Carnelian PMS review and Smart Core PMS review sit on the same shelf.
Common mistakes in a Buoyant Capital PMS vs AIF choice
- Treating AIF history as identical to PMS history. The PMS series starts in 2016. By contrast, AIF Series I starts in late 2022. Same approach is not the same track record.
- Ignoring tax shape. PMS gains hit your return. Cat III tax sits at fund level instead. As a result, model both with a CA before you compare headline CAGR.
- Equating twice-monthly exits with daily liquidity. It is better than many Cat III locks. Even so, it is still not a mutual fund.
- Assuming the next cycle call will be timely for your entry. Five stance shifts since 2016 do not guarantee the sixth is early, late or right for you.
- Skipping the Disclosure Document / PPM. Marketing PDFs are not the governing document, including for fees and operational rules.
Frequently asked questions
Yes. Buoyant Capital Private Limited is registered as a portfolio manager (INP000005000) and manages Category III AIF schemes under IN/AIF3/22-23/1125.
SEBI’s industry minimum for PMS is ₹50 lakh. Afterwards, confirm any manager-specific conditions in the current Disclosure Document.
Most Opportunities AIF series require the SEBI Category III minimum investment of ₹1 crore per investor, with employee/director exemptions where permitted. The Large Value Fund has a higher minimum. Confirm the applicable minimum for the live series you are being offered.
As of 30 June 2026, disclosed TWRR is 20.75% since May 2016 versus 14.11% for the BSE 500 TRI. Past performance is not a guarantee.
No universal winner. For Buoyant Capital PMS vs AIF, ticket, tax admin, liquidity and ownership preference decide the fit.
No entry/exit load and a twice-monthly exit window, per firm materials. Still, it is less liquid than a daily mutual fund.
Flexi-cap and not limited to one sector. Core–satellite weights shift with the cycle stance.
Key takeaway
Buoyant Capital’s PMS and AIF are two legal routes into one cycle-aware, Core–Satellite equity approach. Direct ownership and the longer continuous record sit with the PMS. The AIF gives pooling, fund-level tax and scheduled liquidity that is unusually practical for Category III.
Before you commit, read the current Disclosure Document or PPM, model after-tax outcomes for your residency, and check the live cycle stance, fees and holdings. Numbers start diligence. They do not finish it.
